What We Have Covered in This Article
Last Updated on December 18, 2018 by Editor Futurescope
Data visualization has become one of the most important tools for businesses regardless of the type of enterprise. Its true value lies primarily in the area of data analytics where the information is vital in developing strategies both for increasing revenues and in resolving potential problems. With basic tools that come bundled with office desktop computers, to powerful software from data solutions providers, data visualization has taken information and statistics that are laid out in plain text and made it much easier to understand and to communicate it with others.
How Data Visualization Makes You ‘Seemingly’ Smarter


Put simply, data visualization is the process of taking written information and rendering it in the form of an illustrative or graphical representation. Among the most common types of visual renditions to communicate data include line charts, bar graphs and pie charts. There are other uncommon methods of data visualization, and these are area charts, heat maps, population pyramids, tree maps, histograms, choropleths and Sankey diagrams.
Data visualization takes advantage of basic human physiology, especially on how humans take in and process data. Extensive and decades-long research suggests that the human thought process falls into two main categories: System 1 and System 2.
System 1 is the unconscious thought process when the brain works automatically and in an extremely fast manner. It during this process where one can quickly read and understand a billboard sign, identify the minuscule differences between shades in the same color family, drive on an empty highway, locate the source of a sound, answer 3 plus 3 and so on. System 1 is primarily intuitive and is effortless.
The opposite is true with the System 2 where the thought process is conscious, more calculating, takes more effort and is considerably slower. This system is involved in thought processes such as solving complex mathematical equations,in reciting your Social Security number from memory, recalling the title of a familiar melody, walking faster and maintaining your pace. The study shows that System 1 can process some 11 million pieces of information in a second, whereas System 2 can only manage a paltry 40 pieces per second.
Data visualization works mainly because it triggers the same stimuli that put System1 to work. For instance, a glance at a line chart that depicts sales is enough to communicate to most people that the spikes mean an increase in revenue at certain points, while the dips are the opposite. A choropleth heat map, on the other hand, takes a more complex set of data and lays it on an actual map.Despite the complexity of information, you can get an overview of the large set of data quickly when notice the different intensities on the shading on the map. Weather news reports use a variation of this data visualization to identify the intensity of rain or snowfall on satellite images of various locations.
How Data Visualization Will Help Your Business Communicate in 2019

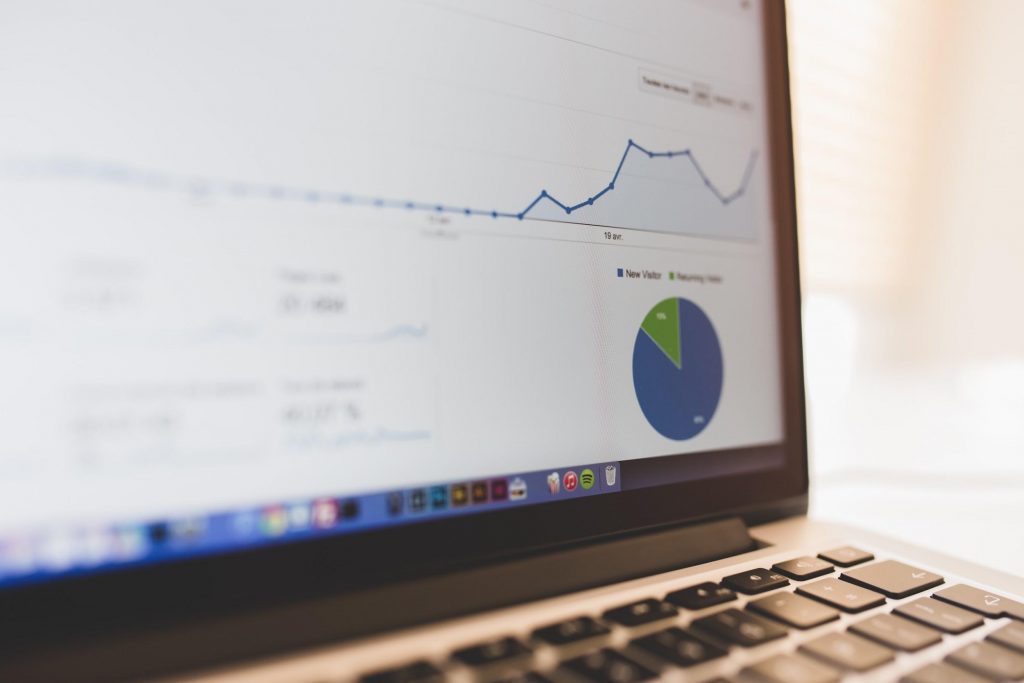
Most, if not all businesses use some form of data visualization usually through basic apps like Excel. However, data visualization can do so much more for a business than just examining regular employee attendance or performance report. It will be a good idea therefore to emphasize your use of data visualization in 2019. Here are some of the main reasons why you should start using data visualization for your business in 2019.
Comprehend Data Better and Faster
Understanding data, especially numbers and statistics, used to be an ability that only a select few such as accountants and data scientists can master. This should come as no surprise as it would be hard to make sense of a seemingly random set of numbers and figures on a worksheet.
Having such information converted into an illustrative visual, however, allows for better and faster comprehension even if you don’t possess any accounting or data management skills. The effectiveness of visuals such as graphs, drawings,illustrations, shapes, colors and spikes is far superior to text if you are trying to relay information quickly. Datavisualization gives you an easier appreciation of information from a more tangible perspective. With visuals, it will be easier to clue in more people with information without needing the help of data scientists at an additional expense.
Examine and Compare Information


Being able to understand the presentation of information easier also improves your ability to evaluate the data without exerting too much effort. You can then channel your extra energy in other areas such as in processing the information and in drawing conclusions from the data. The information is also useful in goal setting such as when comparing the progress of a current project with the goals that you have laid down at predetermined intervals. If reliable data about the competition is available, you can likewise compare where your business stands in the marketplace against your competition.
Detect Patterns and Anticipate Emerging Trends
With data visualization, it will be easier for you to determine patterns where your revenues increased, when worker satisfaction was at its best or when losses were at a minimum. The patterns will likely reveal the variables that led to such positive outcomes thereby clueing you in on how to sustain and even enhance your progress.
Conversely, the patterns will also show areas where you need to improve and likewise expose the outliers in your business operations that are dragging your stats down. Having the ability to see such patterns empowers you to deal with any losses and problematic issues even before they come up.
Patterns can also clue you in on emerging trends such as when customer demand might increase or when sales might dampen. You can then use such information to maximize your revenues or take measures to buffer any losses and keep you afloat during a dry spell.
It is important to remember, however, that data visualization is only as good as the accuracy of the information, as well as the suitability of the visuals for a specific data. For example, a simple line chart is better suited to illustrate sales than to communicate client demographic.Perhaps the best reason for you to give datavisualization in your business operations a boost for 2019 is that you don’t want your competition to get the jump on you if they haven’t already. Data visualization might be the edge that you need to take your business communication to the next level.


